It’s time to wake up and deal with the elephant in our midst.
“In this world nothing can be said to be certain, except death and taxes.” So wrote Benjamin Franklin in 1789. In 21st century America, something else looms just as large: growth. Whether you’re for it, against it or somewhere in between, growth is coming. And it’s coming to the San Francisco Bay Area in the form of a million more people to feed, house, educate and employ by 2020.
Are we prepared? The answer is no, according to the 2006 “Bay Area Smart Growth Scorecard,” a report on the planning policies in the region’s nine counties and 101 of its cities. The study, which was two years in the making, was released in June by the Greenbelt Alliance.
“We were pretty surprised at the results,” says Tom Steinbach, executive director of Greenbelt Alliance, a nonprofit established in 1958 with the aim of making the Bay Area a better place to live by protecting the region’s greenbelt and improving the livability of its cities and towns. “We thought the region would be doing much better, that cities would at least score 60 percent or so. Instead, they scored only 34 percent on average. On the whole, counties did better than cities, but they still averaged just 51 percent. We have a long way to go until the region is well prepared for growth.”
Making the grade
If you think the North Bay—with our lush vineyards, bucolic farmlands, winsome trails, protected habitats, magnificent coastline, charming towns and vibrant cities—has set the bar for the rest of the region, you’ll be disappointed by these results. Granted, we have some very bright spots: Petaluma was ranked the Bay Area’s No. 1 city; Napa and Santa Rosa tied for third place; and Windsor, Rohnert Park, San Rafael, Sebastopol and Novato all ranked in the top 12. But Petaluma only scored 70 percent, which is akin to passing by the skin of your teeth in a top-notch school. And our counties’ policies didn’t stack up so well either: Marin and Sonoma counties tied for fifth place (out of nine), with 46 percent scores, and Napa came in next to last, at 41 percent.
The key to making sense of these statistics is the word “policies.” The study didn’t evaluate how livable communities actually are or what sorts of developments or preservation efforts are in progress. It only examined growth policies currently in place. It also didn’t assess how well communities are implementing their policies.
What’s the point, then? “It’s relatively easy to see what places look like now and what’s being built—it’s harder to see the policies that guide the whole process,” Steinbach explains. “That’s why we did the scorecard.” He also points out that, “Elected officials come and go and, in fact, so do voters. It’s the policies that endure, to guide growth.”
According to Greenbelt Alliance and numerous local and national organizations and governmental entities, such as the Bay Area Council, Association of Bay Area Governments, California’s Department of Housing and Community Development and the U.S. Environmental Protection Agency, being prepared for growth includes having policies in place that promote smart growth.
The EPA defines smart growth as “development that serves the economy, the community and the environment. It changes the terms of the development debate away from the traditional growth/no growth question to, ‘How and where should new development be accommodated?’”
While advocates of smart growth agree on the big picture objectives, they don’t necessarily agree on the details. For example, Smart Growth Network, a national organization and EPA grant recipient, lists “make development decisions predictable, fair and cost-effective” and “encourage community and stakeholder collaboration” among its main smart growth principles. Greenbelt Alliance did not create categories for these in its scorecard.
“There are lots of groups grading and rating cities, so people need to be aware of that,” says Napa Mayor Jill Techel. “Each one has a different set of criteria.” She compared the Bay Area Council’s 2006 Bay Area Housing Profile, which gave Napa a D grade, to the scorecard, which ranked Napa third out of 101 cities for its housing policies. What that says to Techel is that her city has great policies in place and is pacing its growth slowly.
“It’s a challenge,” she says. “Higher densities keep us within our growth boundaries, but designing the projects so they fit with existing neighborhoods takes lots of time and a commitment to meetings between all the stakeholders.”
The circumstances of the North Bay’s diverse communities also change growth priorities from one to the next. The top priority for some is to alleviate traffic congestion. For others it’s revitalizing downtown centers, preserving open space or creating jobs.
After extensive consultation with many local experts, Greenbelt Alliance scored city policies in seven areas: preventing sprawl with urban growth boundaries, making sure parks are nearby, creating affordable homes, encouraging mixed-use development, encouraging density in the right places, requiring less land for parking and defining standards for good development.
The Alliance scored county policies in five areas: managing growth, permanently protecting open space, preserving agricultural land, conserving natural resources and offering transportation choices.
Keeping score
Capturing ninth place among 20 Bay Area cities—and placing first in Marin County—San Rafael was recognized for many of its policies. Its score suffered because it received only 35 percent for development standards. “We were already starting to look at that as a result of input we received from the community,” says Al Boro, who is in his 15th year serving as the city’s mayor. Boro thinks the study was well-executed and put “everybody on a level playing field. Development is always a contentious issue. It’s important we have principles in place to ensure good results.”
San Rafael went through a vision process in the late 1980s and early 1990s, beginning with its downtown community. “We did a lot of things that smart growth principles talk about now. We didn’t know it was going to be called ‘smart growth’; we were a little ahead of the times,” Boro says.
Boro says San Rafael’s success comes from its broad-based community involvement. “Hundreds of people from across the city had a hand in what we did right from the beginning,” Boro recalls. A steering committee, consisting of representatives from the city’s diverse interest groups, worked for two years with a professional facilitator to come up with a plan for revitalizing the city’s downtown, the first neighborhood for which the city did this type of planning. Now civic leaders from other communities are taking tours of downtown San Rafael. “We’re more than willing to share—and we’re not too proud to steal others’ ideas either,” says Boro.
“I think the criteria used to develop the scorecard are probably valid,” says Bob Jehn, mayor of Cloverdale, which ranked 79th, far below its fellow Sonoma County ’burbs. It was dinged for not having an urban growth boundary (UGB). “In fairness to the Greenbelt Alliance, I think it’s very difficult to come up with a one-size-fits-all approach in terms of what communities are doing or have planned. Everyone is different; they’re in different stages of growth.”
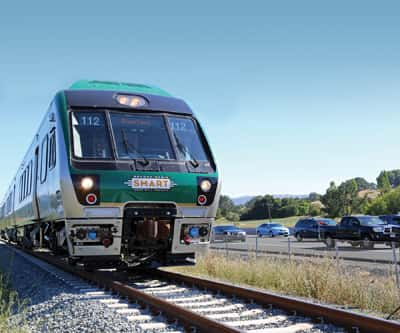
Cloverdale is updating its general plan, which will include transit-oriented development near its SMART train depot. As for its current lack of a UGB, Jehn says Cloverdale is surrounded by hills on the west, north and east. Under its current plan, there can be no significant development above 400 feet elevation, and its downtown is at about 100 feet, so that restricts the possibility of sprawl.
In addition, Jehn points out, “Cloverdale was the first city in this county to have a growth management ordinance, which requires that any time we have applications for 200 or more units in a calendar year, it triggers an infrastructure audit.” This involves looking at such essentials as water supply, police, fire, schools, streets and traffic. “If we don’t have the resources, whether it’s not enough police, not enough classrooms or whatever it is—then it won’t happen. The council really doesn’t have a choice. So that puts some of what’s in the scorecard in perspective.”
Petaluma Mayor Pamela Torliatt says Petaluma’s 1998 approval of its UGB has been the catalyst to develop or redevelop land inside the boundary. By working with Congressional representatives and the Army Corps of Engineers, the city council also successfully reduced its monetary and construction liability for flood control. This let the city use precious redevelopment dollars (and staff time) to complete many projects necessary to implement its smart growth vision, Torliatt says.
Like Boro, Torliatt attributes a large part of her city’s success to community involvement. “I believe it’s most important to include your city’s residents in an open, public process and incorporate everyone’s input,” she says. She also says a focus on getting maximum results for its money enabled the city to “repair dilapidated infrastructure, create property value that can increase sales and property tax revenues for general fund purposes, provide needed housing at all income levels, enhance quality of life, bring amenities for all ages, provide local well-paying jobs and support SMART by creating more riders for increased fare box recovery, to name a few.”
Santa Rosa, which tied on the scorecard with Napa for third place, has much to be proud of, says Vice Mayor Bob Blanchard. He cites numerous innovative programs that reduce greenhouse gases (GHG) and conserve energy and water. The city is also implementing an environmentally preferable purchasing policy. “This will have a direct and daily effect in reducing our waste stream, GHG emissions and environmental footprint,” he says.
Santa Rosa has emphasized city-centered, high-density growth. It’s also reached three of four housing targets identified by the Association of Bay Area Government’s (ABAG) 2009 goals. “The very low [income level] housing target has yet to be reached, but we should be near that goal by 2009,” Blanchard says.
The state of California requires every local government to adopt a comprehensive long-term general plan for physical development. The housing element mandates governments adequately plan to meet the existing and projected housing needs of all economic segments of their communities. ABAG sets those housing targets for each community in the region. The Bay Area Council’s 2006 Bay Area Housing Profile (released in July) assessed how well communities in the region are meeting assigned targets.
Both Torliatt and Blanchard think water efficiency and green building would be excellent criteria to add to Greenbelt Alliance’s next survey. They also encourage civic leaders to get together on a regular basis to share information about what strategies are working in their communities.
Jake Mackenzie is a Rohnert Park city councilmember and has helped shape the city’s policies for 15 years. He is also on the Greenbelt Alliance board. He was very pleased with the overall recognition of Sonoma County’s cities. “Hopefully this will encourage elected officials and senior staff to implement these policies,” he says. “And hopefully it will encourage other jurisdictions to examine their policies and say, ‘If Sonoma County cities can do it, then we should be able to do it, too.’
“An awful lot of it is political will. You have to look at how you’re actually going to create denser, more walkable, livable areas within your cities. You’ll definitely run into roadblocks in the form of the environmental review process, or from citizens within the community who may say they believe growth should be smart but don’t want a particular type of growth in proximity to where they live. And then communities have legal challenges that must be faced.”
Rohnert Park also has a developer agreement policy under which it negotiates conditions of proposed projects. “[Developers] know exactly what they’re entitled to in terms of development conditions, permits, green building, infrastructure and the pace of development. All these types of things are negotiated between the city and the developer; the sign off is done in a public session and becomes a city ordinance.”
Responding in kind
Hillary Gitelman, Napa County’s director of planning, is very supportive of Greenbelt Alliance, but she thinks it didn’t hit the mark with its first scorecard. (The Alliance expects to issue new smart growth scorecards every three to five years.) “In Napa County, we were very disturbed when the scorecard came out, because we felt the methodology used was particularly poor and our score wasn’t representative of the good work Napa County has done over the last 30 years,” she says.
“We’ve been dedicated to open space and agricultural preservation ever since the agricultural preserve was created in 1968, and this kind of analysis really doesn’t help,” she continues. “The scorecard methodology overemphasizes the county’s lack of a park district—something we’re working to remedy on this November’s ballot—but even without a park district, Napa County has more than 120,000 acres of dedicated open space, and nearly 90 percent of the county is open in that it’s outside urbanized areas…. If there’s any place that’s implemented smart growth, it’s Napa County.”
Napa County Supervisor Bill Dodd concurs. “Although we’re in the middle in terms of total acreage, as far as open space per capita, we’re in the top two; San Francisco is higher,” he says. “As for transportation, I fail to see any reason we scored so low, particularly when our transportation plans include significant regional transit improvements and transportation demand management.”
Dodd says that in 1968, Napa committed itself to its agricultural heritage. “In more rural counties, I think the expectation to work toward the same densities as larger counties is counter to smart growth principles.”
Explaining Napa County’s scores, Greenbelt Alliance’s field representative for Solano and Napa counties, Nicole Byrd, says, “Napa is the only county in the region that has no park department and no open space district, and its score reflected that. It does have public open space, but there’s no public agency to maintain the land and open it up so Napa residents can enjoy it. Parents can’t take their children to play in it, and people can’t picnic or hike in it. By the time the December issue comes out, the election will be over, so I hope Napa County will have its new Open Space District. I don’t think people realize the degree to which the open space in Napa is unprotected. It also has no substantial public transportation system—people here have few options for getting around except using their cars.”
Aside from Napa’s concerns, Daisy Pistey-Lyhne, Greenbelt Alliance’s field representative for Sonoma and Marin counties, says, “Many cities in Marin have done little to adopt smart growth policies due to low growth rates. However, many individuals and officials in Marin have welcomed the scorecard because it points to the need for both better development in the cities and stronger protection for the farmlands and natural habitat outside the cities. While Marin County is thought of as having very strong protections for farmlands, we found the county scored very low in this category.”
Most of Marin County’s cities lack UGBs. “Marin’s cities traditionally rely on the county and board of supervisors to continue enforcement of its 1973 land use corridor approach for open space protection. It includes the western recreation and open space corridor, rural inland agriculture and open space corridor and the eastern corridor where development is directed. The cities thus rely on this long-term discipline to obviate any need for specific and local UGBs,” says Marin County Supervisor Charles McGlashan. “But a change in the make-up of the board of supervisors could make Marin vulnerable. On the other hand, UGBs have their problems, too. I feel we’re in good shape but also deserved the lower score. It helps to ensure no one ever gets too sanguine about Marin’s need to take real care in preserving habitat and open space; it boils down to making sure the board of supervisors—and candidates for it—never forget the will of the people in protecting our open space.”
Pistey-Lyhne says that while Sonoma County had the highest overall average city score, the county must adopt policies to better define its role in the smart growth vision. “The cities should be where the vast majority of growth occurs, with a small amount in the towns,” she says. “Unincorporated lands outside urban service areas should not be areas for development. Urban growth boundaries are the cities’ commitment to this vision. Now the county needs to reinforce this vision with stronger protections for the greenbelts around the cities.”
Charlie Carson, executive director of the Northern Division of the Homebuilders Association of Northern California, doesn’t think cities should be responsible for actual units being built. “The responsibility of the municipality is to facilitate, through its general plan, the types of dwelling units it wants to see built. But for a variety of reasons—consumer preferences, home buying markets, job formation, the cost of money—the actual number of units built will never match what’s planned. The dynamics of the economy, both positive and negative, are virtually guaranteed to change each year,” he says.
Carson thinks that, while everyone is interested in resource conservation, if smart growth is perceived as high-density housing around a rail line (that doesn’t have rolling stock around it yet), and if smart growth in a particular municipality also means no other types of housing are favored, there can be unintended consequences to the local economy. He says right now, encouraging density is most valid in urban areas because mass transit is already in place to accommodate residents who will occupy new housing units.
Carson agrees that smart growth requires the cooperation of stakeholders, which he defines as the business communities, local governments, regulatory agencies and environmental protection communities. “Whatever is done for municipal planning needs to represent a compromise with all of these different views. Then there’s the challenge to get the general populace to understand what the stakeholders are doing. In many cases, the population doesn’t pay that much attention unless it affects them directly.”
Carson emphasizes that financing smart growth looms large. “Generally the facilities happen because it’s part of an overall larger project that includes the private sector, [which] is actually the element that has the money, because the state and federal reserve funds are so limited. It’s great to talk concepts; it’s like your thesis for your masters. But it never includes the reality about expenses. Municipalities know about that because they’re the ones that incur expenses.”
So, has the scorecard been a success? “The scorecard really got people talking about the growth the whole Bay Area is facing. It highlighted the fact that, although each city and county makes its own growth decisions, they all have regional impacts. And they’re impacts we have to tackle together,” says Byrd.
And that will require visionary leadership, without which smart growth cannot be realized. Unfortunately, unlike death and taxes, great leadership isn’t inevitable.