
Data from the Census Bureau on population through June 30, 2025 (since the previous July 1), along with the California Department of Finance (DOF) fiscal-year population estimates, are typically released near the time of the California Governor’s Budget in early January. These data provide insight into population trends by comparing statewide Census estimates with the California Department of Finance’s estimates for the state’s 58 counties. Tracking change since the last Census — and ahead of the next Census for congressional mapping — is just one outcome. At the state level, DOF data helps counties examine why populations are changing and what trends are driving them. Such data can inform local economic and workforce development, school districts and policymakers.
For Marin, Napa and Sonoma counties, the latest DOF data suggest a combined loss of 460 residents: Marin County was estimated to have lost 969, Napa gained 492, and Sonoma gained 17. An important aspect of these data, which are “trued up” and finalized after the next Census, is the trend. In Marin County, the population reversal began in earnest in 2017, and there has been a loss of over 11,000 since the population peak. Marin County is estimated to have roughly the same population in July 2025 as it did in July 2010. Sonoma and Napa counties experienced similar trends but have slowly reversed the population’s direction after the pandemic shock: Napa is estimated to have lost 4,510 residents since its peak and also remains below its 2010 population level; Sonoma County is estimated to have lost 18,130 residents since its peak, bringing the population close to 2010 levels. The intra-county changes are not available yet; the Census Bureau provides its estimates from the American Community Survey later in the year.
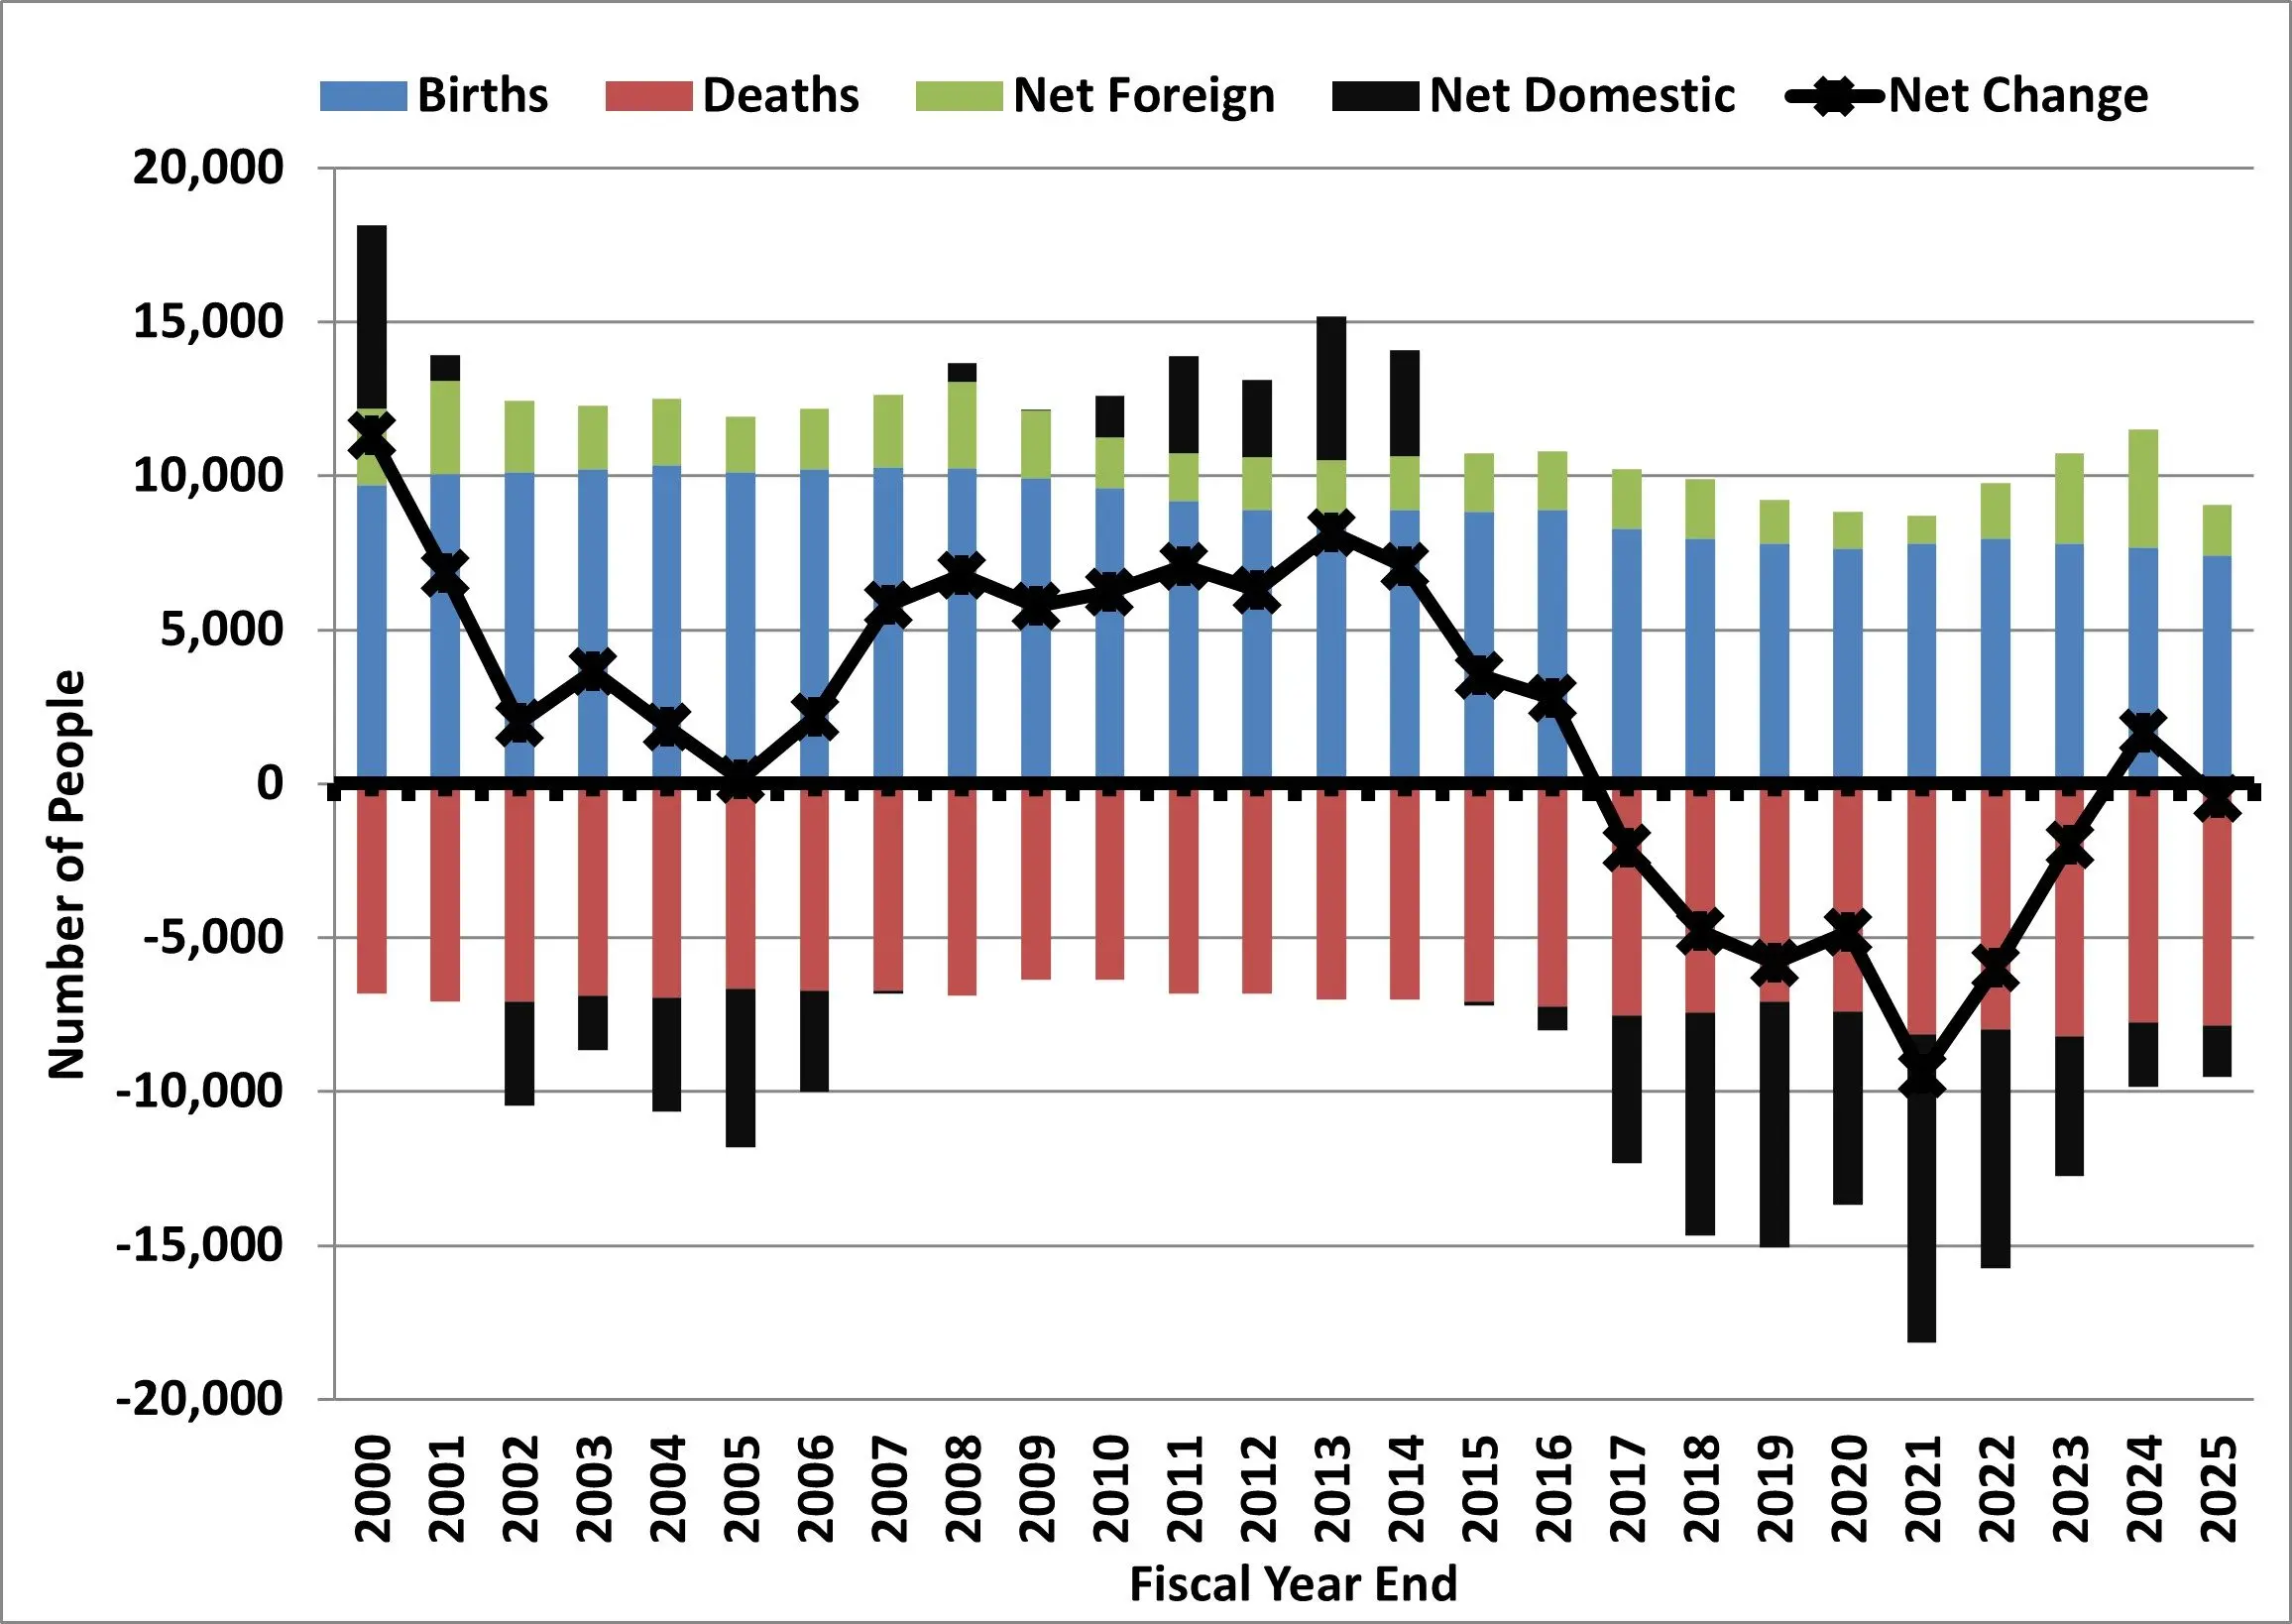
What is available are categorical components that explain the change. The levers are easy to understand: births, deaths (in sum, think “natural change”), net migration from outside the county to points within the United States, and net migration from other countries. The graphic below shows the four categories and the net change across these three counties. As the graphic shows, migration trends have reversed since the mid-2010s: international migration does not offset the number of people leaving for other parts of California and other states, and that is unlikely to change due to work visas and general immigration policies. Notice the black columns showing “domestic” migration, which have been negative for some time, specifically after the 2017 fires and then again after the pandemic’s main problem years (2021 and 2022). However, births and deaths are also worth watching, as they indicate a general trend in this region: we are aging.
Public policy makers face a set of challenges. Housing prices are relatively high here. Wealth is often the primary factor in homeownership here, followed by income. Wage levels have generally lagged state averages outside Marin County, whose economy is more closely tied to the greater Bay Area. When wealth is the main reason someone can live in a certain place, the population ages. Emigration to other places is generally an economic decision: a family seeks a better balance between the cost of living and the cost of making a living. We need economic reasons for new residents to come and stay; otherwise, the region is not naturally attractive as a place to live.